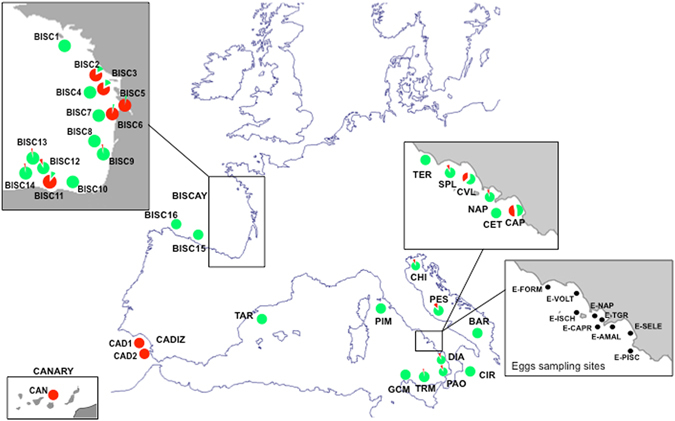
Figure 1.

Position of the sampling sites utilized in the present analysis. Proportion of offshore (green) and the coastal (red) ecotypes is shown for each site. Sites sampled for anchovy eggs are shown in the lower right panel. Detail of populations sampled in the Bay of Biscay by Montes et al.20 is shown in the upper-left panel. Assignment to the coastal and offshore ecotypes by Montes et al.20 is given in Table 1. The map was generated using QGis software v.2 (Quantum GIS Development Team, 2013) and modified by authors using Powerpoint software (2013) www.microsoft.com.
