Figure 3.

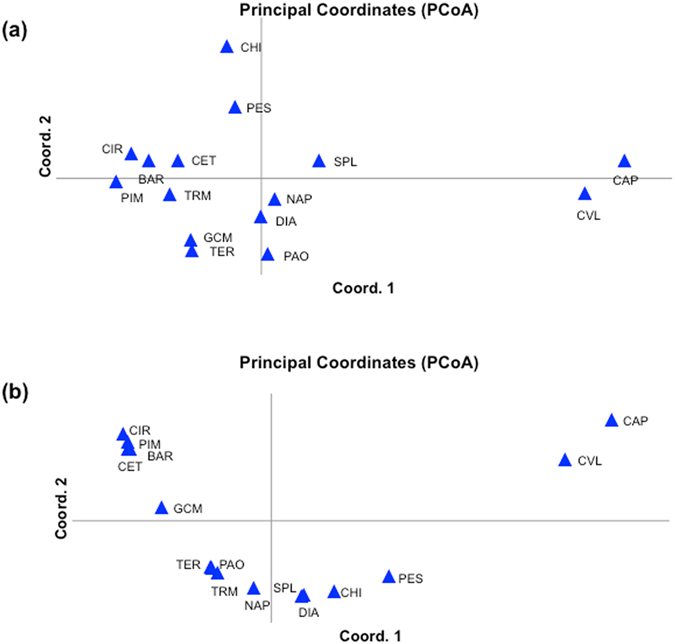
PCoA of Mediterranean anchovy samples, based on SNPs data using: (a) Only putative neutral markers (variance of Axis 1: 21%; variance of Axis 2: 12%); (b) Only putative outlier markers (variance of Axis 1: 81%; variance of Axis 2: 10%).

PCoA of Mediterranean anchovy samples, based on SNPs data using: (a) Only putative neutral markers (variance of Axis 1: 21%; variance of Axis 2: 12%); (b) Only putative outlier markers (variance of Axis 1: 81%; variance of Axis 2: 10%).