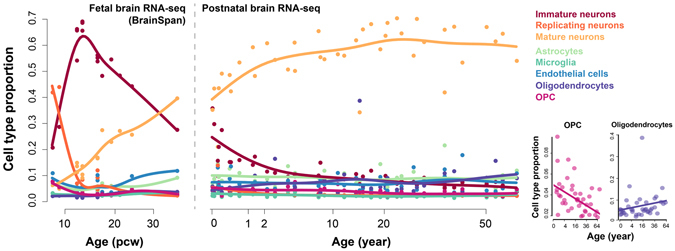
Figure 1.

The cell type compositions across lifespan in human brains, estimated using the DR-based deconvolution. The dots show the estimated proportions of samples, and the curves show the spline interpolation results. The left panel shows the cell type composition in human fetal brains, based on the human embryonic developmental brain RNA-seq data from BrainSpan; the right panel shows the cell type composition in human postnatal brains, based on the human postnatal brain data set. The bottom-right panels show proportions of OPC and oligodendrocytes in the human postnatal samples.
