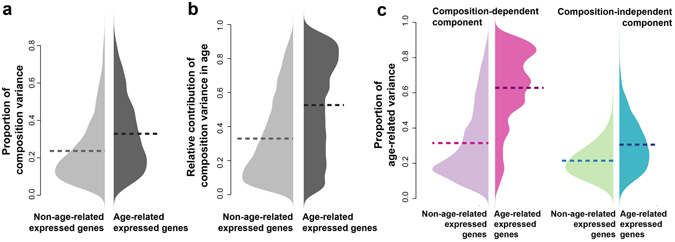
Figure 3.

The cell type composition change was the primary driving force of the age-related expression. (a) The proportion of gene expression variance explained by cell type composition (composition-related variance) in the human postnatal brain data set. Light grey – genes without age-related expression; dark grey – genes with age-related expression. The horizontal dash lines show the mean proportion of composition-related variance. (b) The relative contribution of the composition-dependent component to the variance explained by age (age-explained variance), measured as ratio of age-explained variance in the composition-dependent component to the sum of age-explained variance in both components. Light grey – genes without age-related expression; dark grey – genes with age-related expression. The horizontal dash lines show the mean proportion of composition-related variance. (c) The proportion of variance explained by ages (age-related variance) in each of the two components of expression: pink – the composition-dependent component; green – the composition-independent component. The light colors represent the proportions of age-related variance in genes without age-related expression changes; the dark colors represent the proportions of age-related variance in genes with age-related expression changes. The horizontal dash lines show the means of age-related variance proportions.
