Figure 4.

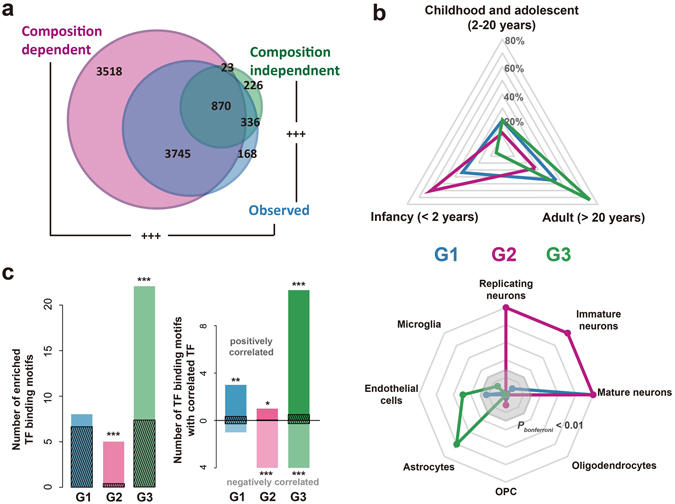
Age-related changes happened in the composition-dependent components and composition-independent components. (a) The number of genes with age-related changes in each component or the observed expression level, based on the human postnatal brain data set (blue – observed expression level; pink – composition-dependent component; green – composition-independent component). (b) The expression properties of genes with age-related changes in the composition-dependent or composition-independent components. G1 – genes with age-related changes in both components; G2 – genes with age-related changes only in the composition-dependent component; G3 – genes with age-related changes only in the composition-independent component. Top: proportion of genes with highest expression level at each of the three lifespan stages. Bottom: expression enrichment in each of the eight cell types for the three groups of genes, represented as −log10(P), where P being the p-value of one-sided Wilcoxon’s rank test of log10-transformed fold change from the particular cell type to the remaining cell types, between each of the three groups of genes and all the expressed protein-coding genes. The grey octagonal boxes represent −log10(P) equaling to values from ten (the outermost box) to two (the inner most box). Strong expression enrichment with −log10(P) > 10 was presented as ten. (c) Regulation of genes with age-related changes in either component by transcription factors (TFs). (Left) the number of TF binding motifs enriched among genes within each group. The dark streaked bars represent the mean number of enriched TF binding sites expected by chance, calculated by 1000 random assignment of the expressed genes into the three groups. (Right) the number of TF binding motifs with its representative TF correlated with the targets (correlated TF binding motifs) in the same group. The dark streaked bars represent the mean number of correlated TF binding motifs expected by chance, calculated by 1000 random assignment of the expressed genes into the three groups. The asterisks show significance of the numbers (*P < 0.05, **P < 0.01, ***P < 0.001, Bonferroni corrected).
