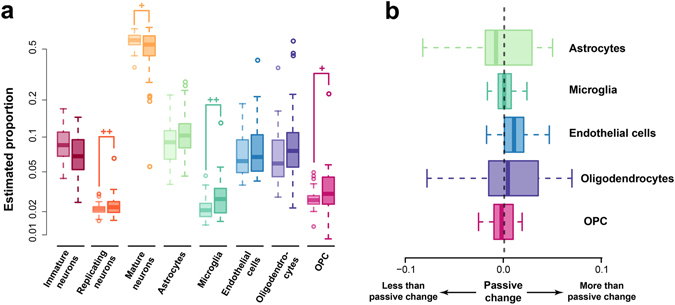
Figure 5.

Alteration of cell type composition in autism. (a) The estimated proportions of each cell types in autism case samples and healthy control samples with ages at the same age range. Each pair of boxes with the same color show the proportions of one cell type, with the left box represents the proportions in healthy samples, and the right box represents the proportions in autism samples. The plus signs mark significant difference according to Wilcoxon’s test (+− P < 0.1; ++−P < 0.05). (b) The disparity of observed altered non-neuron cell type compositions and the predicted altered compositions with the assumption of passive change of non-neuron cell type composition. Each box with a different color showed the observed altered proportion of one non-neuron cell type subtracted by the predicted altered proportion of the cell type based on the altered proportion of neurons scaled by the relative proportions of the non-neuron cell type in healthy samples.
