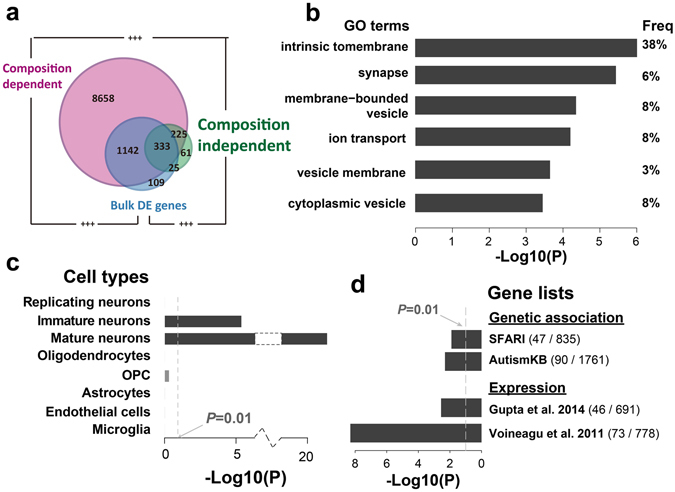
Figure 6.

Composition-dependent and independent transcriptome alteration in autism. (a) The number of genes with autism alterations in each component or the bulk expression levels (blue – bulk expression levels; pink – composition-dependent component; green – composition-independent component). The plus signs mark the significance of overlap (+++− Fisher’s exact test P < 0.0001). (b–d) Functional characterizations of genes with autism alterations in the composition-independent components, including GO enrichments (b), cell type expression enrichments (c) and enrichments of autism-associated genes (d). The bars show the log10-transformed P-values. The values within brackets in the button right panel show the numbers of all associated genes (right) and the sizes of the overlap with genes with autism alterations in their composition-independent components (left).
