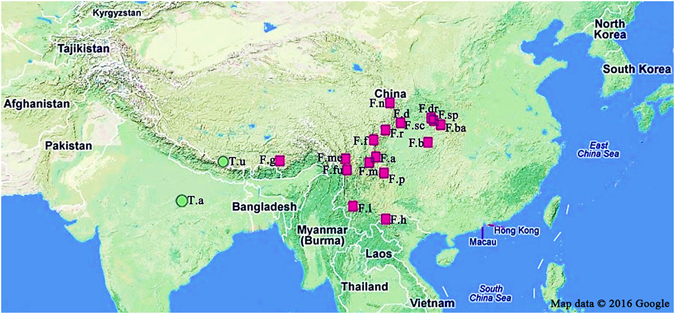
Figure 4.

Geographic distribution of accessions of Fargesia and Thamnocalamus species used in this study. Red squares represent Fargesia species, and green circles indicate Thamnocalamus species. Please see Table 1 for details. The figure was generated with Adobe® Photoshop® CS3 extend 10.0.1 software (Adobe Systems Inc., San Jose, CA, USA; URL link: https://www.adobe.com/products/photoshop.html ? promoid = KLXLS) based on Google® maps (Google Inc., Mountain View, CA, USA; URL link: https://www.google.com/maps).
