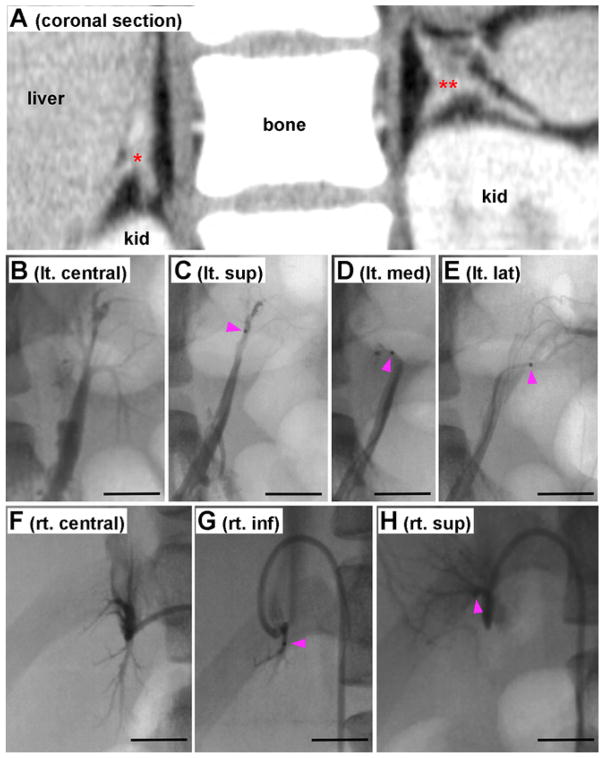
Fig. 1.
CT, cAVS, and ssAVS A: A frontal section image of computed tomography. Red * and ** indicate right and left adrenal glands, respectively. B: Conventional adrenal venous sampling (cAVS) from left adrenal vein. Superior, medial, and lateral tributary veins (TVs) were shown by infusion of contrast medium. C: Superselective AVS (ssAVS) from left superior TV. D: ssAVS from left median TV. E: ssAVS from left lateral TV. F: cAVS from right central adrenal vein. Superior and inferior TV were shown. G: ssAVS from inferior TV. H: ssAVS from superior TV. Bars indicate 1 cm. Pink arrowheads in panels C, D, E, G, and H indicate head of a microcatheter. (For interpretation of the references to colour in this figure legend, the reader is referred to the web version of this article.)

