Fig. 5.
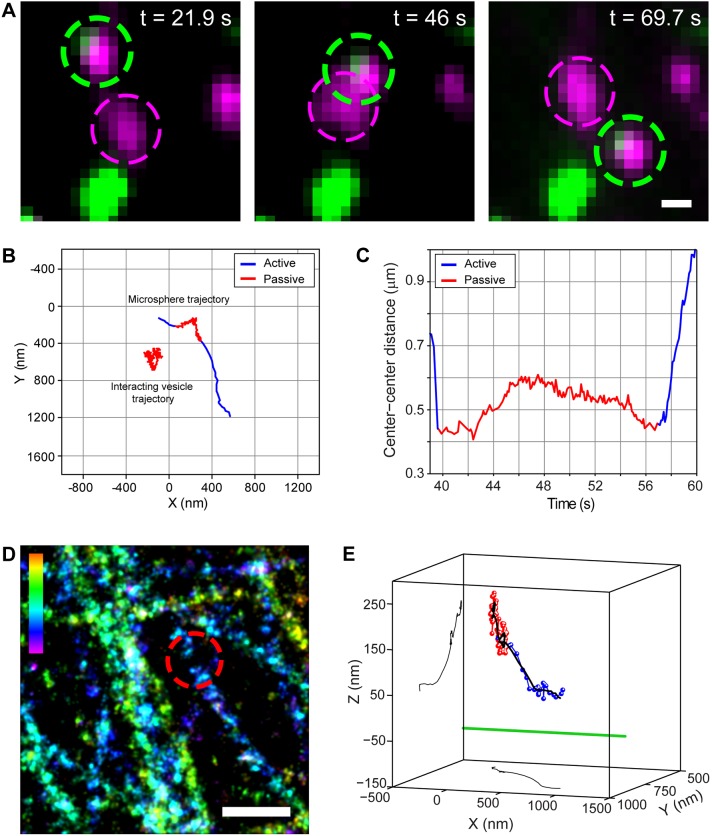
Off-axis mode motion helps circumvent vesicular obstacles. (A) Image sequence showing a vesicle–vesicle interaction at different time points. The green and magenta dotted circles highlight the tracked microsphere and the interacting vesicle, respectively. Magenta shows LysoTracker and green shows the microsphere. (B) 2D trajectories of the microsphere-containing and interacting vesicles. (C) The center-to-center distance of the two vesicles before, during and after the encounter. (D) 3D super-resolution image of microtubules. The dotted red circle shows the place of interaction. The color scale bar represents z-position (between −200 nm, magenta, and 300 nm, red). (E) 3D plot placing the microsphere trajectory in the context of its microtubule path (green, not to scale). The smoothed trajectory (10-point sliding window average) and its corresponding xy- and yz-projections are shown in black. For B,C and E, active and passive transport phases in the raw trajectory are shown in blue and red, respectively. Scale bars: 500 nm.

