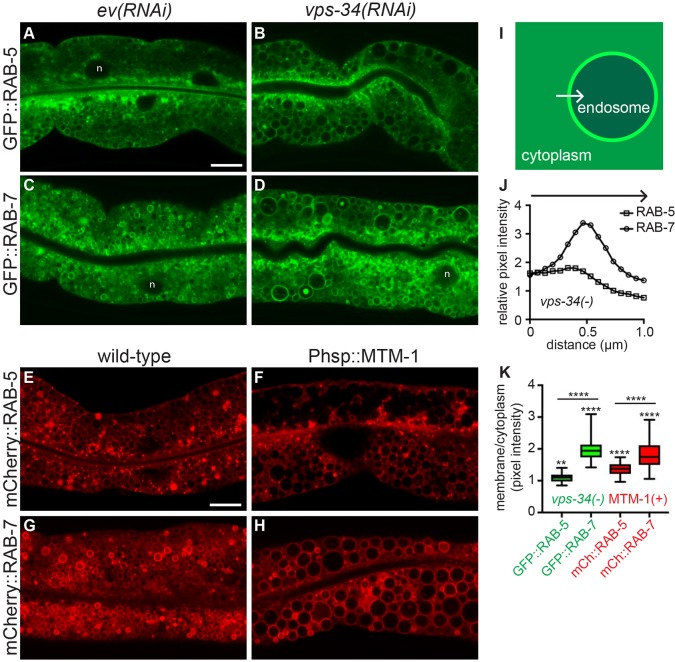
Fig. 2.
Loss of VPS-34 or overexpression of MTM-1 induces enlarged endosomes. (A–D) Representative confocal images of GFP::RAB-5 (A,B) and GFP::RAB-7 (C,D) localization in wild-type L4 larvae treated with empty vector (ev) RNAi (A,C) or vps-34(RNAi) (B,D). RNAi was performed a minimum of three times with >20 animals scored per experiment. (E–H) Representative confocal images of mCherry::RAB-5 (E,F) and mCherry::RAB-7 (G,H) in wild-type L4 larvae (E,G) or L4 larvae expressing Phsp::mtm-1 (F,H). n denotes nuclei (A,C,D). (I) Illustration of how cytoplasmic versus membrane fluorescence intensity was measured. A 1 μm line was drawn from the cytoplasm, across the membrane into the endosome lumen using ImageJ, from which the intensity was measured. (J) The average intensity profiles for GFP::RAB-5 and GFP::RAB-7 from a total of 30 vesicles from 5–10 vps-34(RNAi) animals. (K) The average of the three highest intensity points across the membrane divided by the average of the first three cytoplasmic intensity points were used to generate a membrane:cytoplasmic ratio for 30 vesicles per condition to generate a box-and-whisker plot for GFP::RAB-5 and GFP::RAB-7 in vps-34(RNAi) animals (data from J) as well as for mCherry::RAB-5 and mCherry::RAB-7 from 6-10 Phsp::mtm-1 expressing animals. The box represents the 25–75th percentiles, and the median is indicated. The whiskers show the minimum to maximum of all data. **P<0.01, ****P<0.0001 (a paired t-test was used to determine the significance of the difference in membrane versus cytoplasmic intensities for each condition, and an unpaired t-test was used to determine significance of differences in membrane:cytoplasmic ratios between RAB-5 and RAB-7 in each condition). Scale bar: 10 µm.

