Fig. 5.

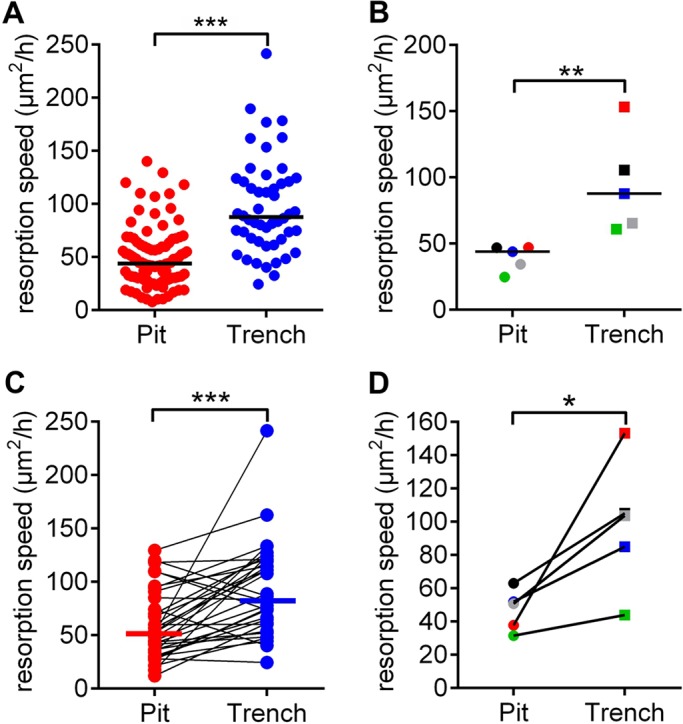
Resorption speeds of OCs in pit and trench mode. (A) The resorption events of a single experiment were classified as pits (n=94) or trenches (n=50). Each dot represents the speed of a resorption event. Horizontal lines indicate the medians. ***P<0.001 (two-tailed Mann–Whitney test). (B) Median resorption speeds of pit and trench formation, assessed in five different experiments (as shown in A) each represented by a dot. Horizontal lines indicate the medians. **P=0.008 (two-tailed Mann–Whitney test). (C) The respective resorption speeds that were recorded in the experiment shown in A are only shown here for individual OCs switching from pit to trench mode (paired results; n=34). Horizontal lines indicate the medians. ***P<0.001 (two-tailed Wilcoxon matched-pairs signed rank test). (D) Median speeds of five different experiments (as shown in C). *P=0.031 (one-tailed Wilcoxon matched-pairs signed rank test).
