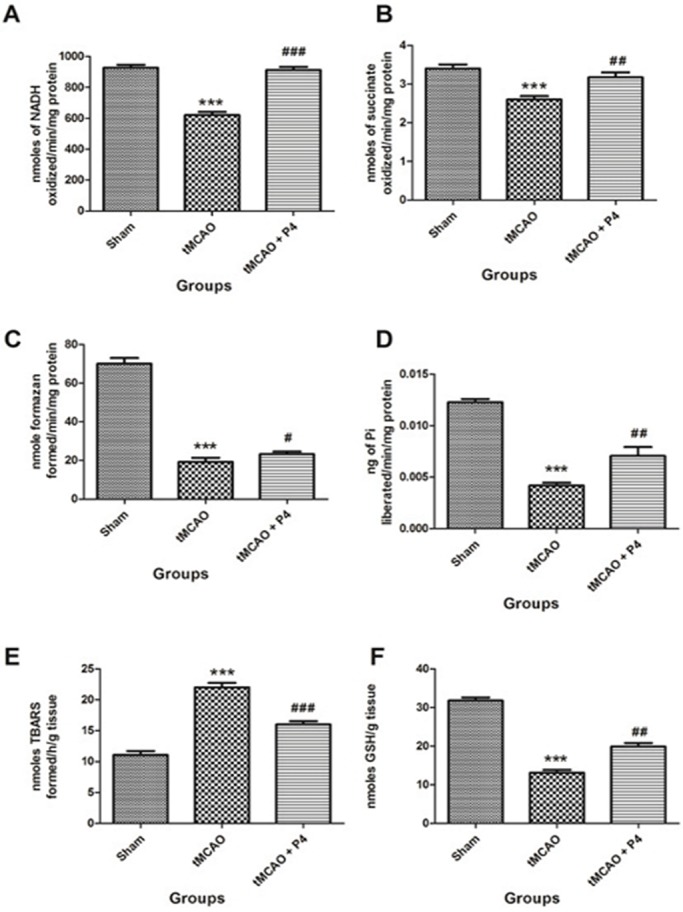
Fig. 3.

Effect of P4 on mitochondrial complexes and oxidative parameters. Analysis of the levels of mitochondrial complexes in isolated mitochondria from the frontal cortex of the brain (n=6 in each group). (A) Effect of P4 on NADH dehydrogenase (complex I). ***P<0.001 versus sham, ###P<0.001 versus tMCAO. (B) Effect of progesterone on succinate dehydrogenase (complex II). ***P<0.001 versus sham, ##P<0.01 versus tMCAO. (C) MTT assay was done to assess the metabolic activity of cells in the frontal cortex of the brain (n=6). ***P<0.001 versus sham, #P<0.05 versus tMCAO. (D) Effect of P4 on F1-F0 synthase activity (complex V). ***P<0.001 versus sham, ##P<0.01 versus tMCAO. (E) Effect of P4 on mitochondrial lipid peroxidation. ***P<0.001 versus sham, ###P<0.001 versus tMCAO. (F) Effect of P4 on mitochondrial GSH. ***P<0.001 versus sham, ##P<0.01 versus tMCAO.
