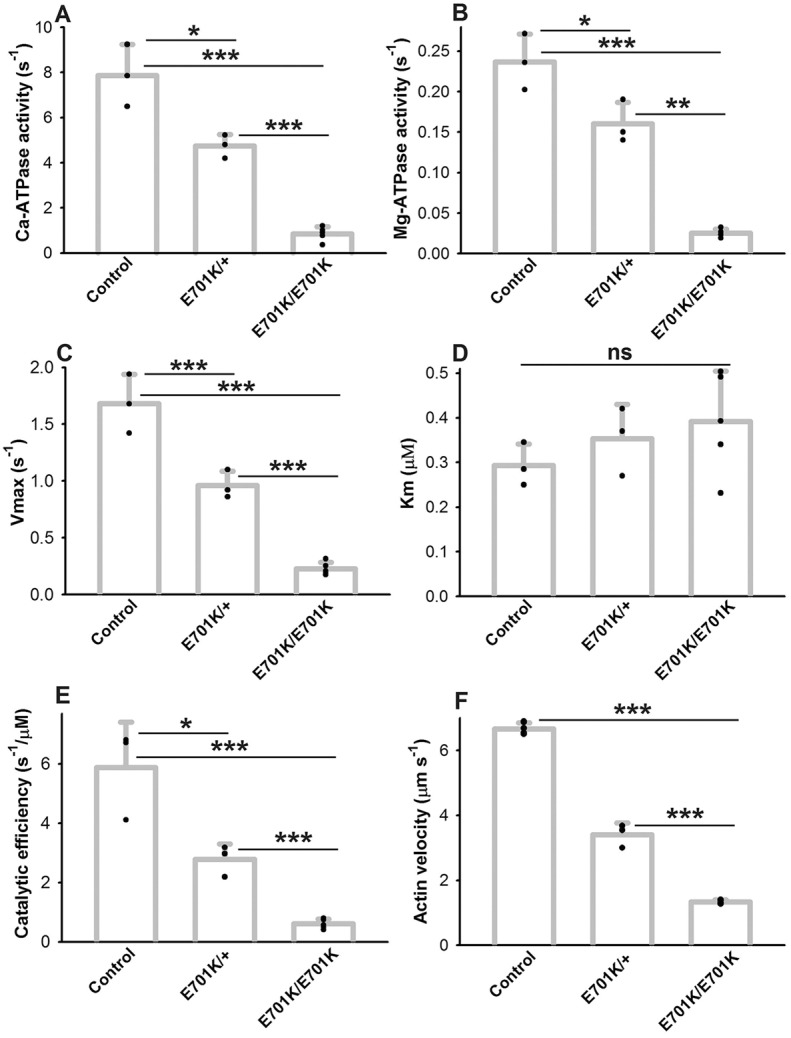
Fig. 1.

ATPase activities and in vitro motility values for myosin from E701K/+ heterozygotes are intermediate between those of homozygotes and wild-type controls. (A) CaATPase activities. The value for the E701K/+ heterozygote is significantly different from both PwMhc2/+ control and E701K/E701K homozygotes. (B) MgATPase activities. The value for the E701K/+ heterozygote is significantly different from both control and E701K/E701K homozygotes. (C) Vmax for actin-activated MgATPase activities. The value for the E701K/+ heterozygote is significantly different from both control and E701K/E701K homozygotes. (D) Km values are actin concentrations at which half-maximal actin-activated MgATPase activities (Vmax) are exhibited. No significant differences are exhibited among the samples. (E) Catalytic efficiency (ratio of Vmax to Km). The value for the E701K/+ heterozygote is significantly different from both control and E701K/E701K homozygotes. (F) In vitro velocity of actin filaments propelled by myosins of each genotype. The value for the E701K/+ heterozygote is significantly different from both control and E701K/E701K homozygotes. In all E701K/E701K homozygote assays, n=4. n=3 for all other samples, except control in vitro motility (n=5). E701K/E701K homozygote data median values and wild-type motility median values are from Wang et al. (2012). Each ATPase data point is a biological replicate that is the mean of duplicate technical replicates. In vitro motility biological replicates represent the mean of over 20 actin filaments per sample. Statistical significance was measured using Student's t-test (*P<0.05; **P<0.01; ***P<0.001; ns=not significant). All values are mean±s.d.
