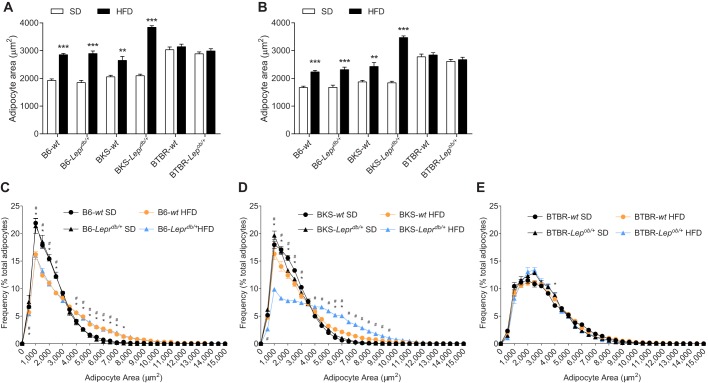
Fig. 2.
Adipocyte histomorphometry of epididymal white adipose tissue. (A,B) At study conclusion, area analysis was performed on adipocytes within epididymal white adipose tissue using MetaMorph software. Graph in A shows mean values whereas that in B shows median values. (C-E) Size–frequency distribution was calculated to account for changes in both adipocyte number and size. Six sections, more than 100 µm apart were averaged per mouse. Data are mean±s.e.m. (median±s.e.m. in B) from n=6 mice/group. In A,B, **P<0.01, ***P<0.001, wild-type mice fed HFD versus SD; in C-E, *P≤0.05, wild-type mice fed HFD versus SD; #P≤0.05, Leprdb/+ or Lepob/+ mice fed HFD versus SD.

