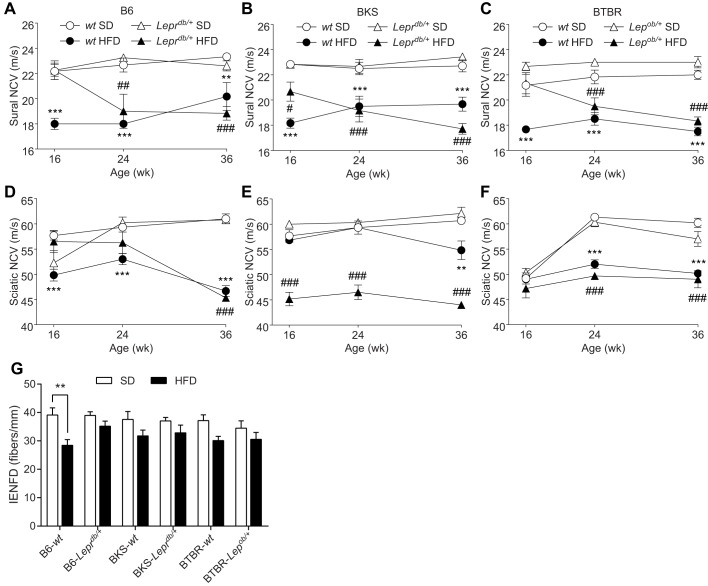
Fig. 3.
Measures of nerve fiber function and intra-epidermal nerve fiber density. Sural (A-C) and sciatic (D-F) nerve conduction velocities (NCVs) were measured at 16, 24 and 36 weeks for all groups (n=6/group). Anatomical measures of intra-epidermal nerve fiber density (IENFD) were measured for all groups at 36 weeks of age (G; n=8/group). Data are mean±s.e.m. White circles: wild-type mice fed standard diet (SD); white triangles: db/+ or ob/+ mice fed SD; black circles: wild-type mice fed HFD; black triangles: Leprdb/+ or Lepob/+ mice fed HFD. Ordinary two-way ANOVA with Tukey's multiple comparisons test performed on the four datasets within the individual figures (A-F). Ordinary two-way ANOVA with Bonferroni's multiple comparisons test were performed on IENFD (G). **P<0.01, ***P<0.001, wild-type mice fed HFD versus SD; #P<0.05, ##P<0.01, ###P<0.001, Leprdb/+ or Lepob/+ mice fed HFD versus SD.

