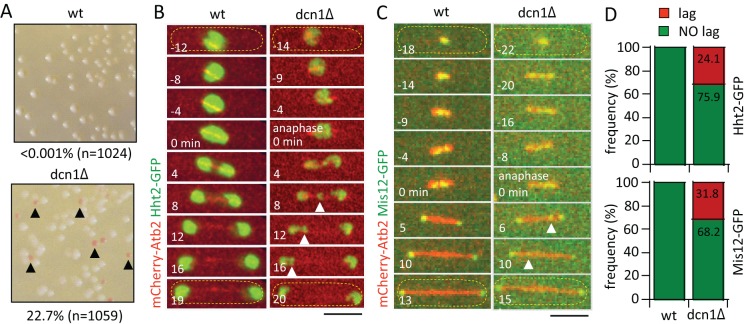
Fig. 1.
dcn1-deletion results in chromosome segregation defects at mitosis. (A) Artificial minichromosome-loss color assays for wild-type (wt) and dcn1Δ cells. Pink colonies (black arrow heads) represent minichromosome-losses. Data are representative of three independent experiments pooled together. (B) Time-lapse images of mitotic wild-type and dcn1Δ cells expressing mCherry-Atb2 (tubulin) and Hht2-GFP (histone H3, chromosome marker). Time 0 min arbitrarily marks the start of anaphase, where the spindle length begins fast elongation. Chromosome lagging at anaphase is evident in the dcn1Δ cell (white arrow heads). Yellow dashed outlines indicate the cell. Scale bar: 5 μm. (C) Time-lapse images of mitotic wild-type and dcn1Δ cell expressing mCherry-Atb2 and Mis12-GFP (kinetochore marker). Kinetochore lagging at anaphase is evident in the dcn1Δ cell (white arrow heads). Scale bar: 5 μm. Yellow dashed outlines indicate the cell. (D) Top plot shows frequency of lagging chromosome (n=29 dcn1Δ cells, n=24 wt cells; data are pooled from three independent experiments; χ2 test, P<0.001). Bottom plot shows frequency of lagging kinetochore (n=22 dcn1Δ cells, n=20 wt cells; data are pooled from three independent experiments; χ2 test, P<0.001).

