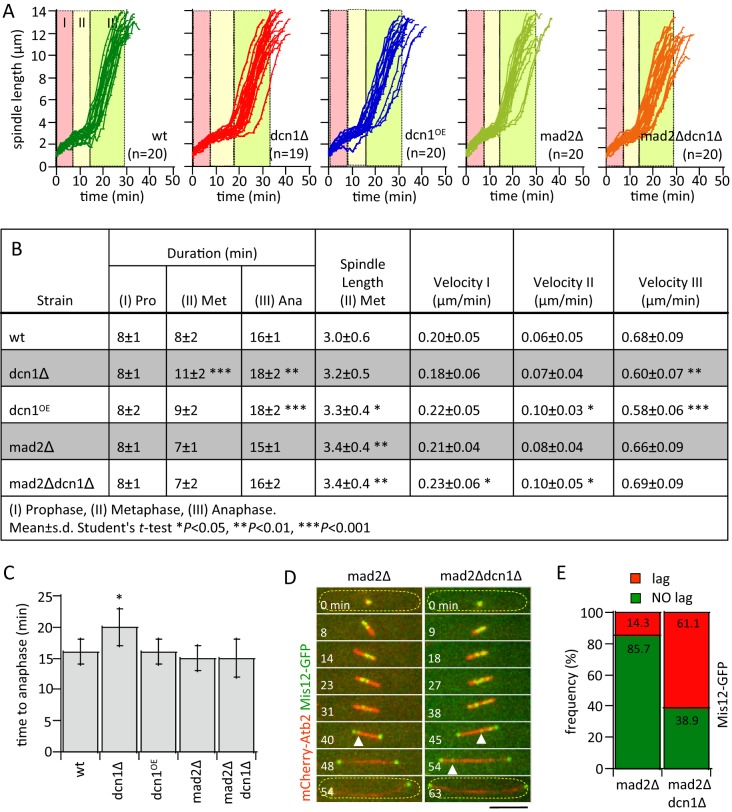
Fig. 2.
dcn1-deletion activates the Mad2-dependent spindle assembly checkpoint and delays mitotic progression. (A) Comparative plots of spindle length versus time of wild-type (wt), dcn1Δ, dcn1OE, mad2Δ, and mad2Δdcn1Δ cells. Color partitions define the average duration of the three stages of spindle elongation, taken from (B). Stage I, prophase; stage II, metaphase; stage III, anaphase-A and -B. (B) Spindle dynamic parameters in wild-type, dcn1Δ, dcn1OE, mad2Δ, and mad2Δdcn1Δ cells (mean±s.d.; n=21 wt, n=19 dcn1Δ, n=20 dcn1OE, n=20 mad2Δ, n=20 mad2Δdcn1Δ cells). (C) Bar plot of time-to-anaphase combined stages I and II from B. Student's t-test, *P<0.05. Data are presented as mean±s.d. (D) Time-lapse images of mitotic mad2Δ and mad2Δdcn1Δ double-deletion cell expressing mCherry-Atb2 and Mis12-GFP (kinetochore marker). Kinetochore lagging is evident in both strains (white arrow heads). Yellow dashed outlines indicate the cell. Scale bar: 5 μm. (E) Plot shows frequency of lagging kinetochore between mad2Δ (n=14 cells) and mad2Δdcn1Δ (n=18 cells). Data are pooled from three independent experiments; χ2 test, P<0.001.

