Fig. 3.
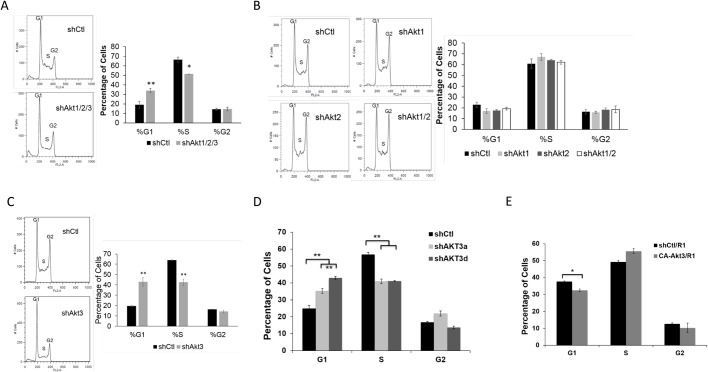
Akt3 is responsible for G1/S transition in ESCs. (A) ESCs expressing lentiviral shCtl or shAkt1/2/3 for 3 days were incubated with PI and RNase for 30 min and subjected to cell cycle analysis by flow cytometry. The percentages of cell in G1, S, and G2 phases are shown on the right (data shown are mean±s.d., *P<0.05, **P<0.01, n=2). (B) Cell cycle analysis of R1-ESCs treated with shCtl, shAkt1, shAkt2, or shAkt1 plus 2 (shAkt1/2) for 3 days and cultured in 2i/LIF medium. The percentages of cell in G1, S, and G2 phases are shown on the right (data shown are mean±s.d., n=2). (C) Cell cycle analysis of R1-ESCs treated with shCtl or shAkt3 for 3 days and cultured in 2i/LIF medium. The percentages of cells in G1, S, and G2 phases are shown on the right (data shown are mean±s.d., **P<0.01, n=2). (D) Cell cycle analysis of R1-ESCs treated with shCtl, shAkt3a, or shAkt3d for 3 days and cultured in 2i/LIF medium. The percentages of cells in G1, S, and G2 phases are shown on the right (data shown are mean±s.d., **P<0.01, n=2). (E) Cell cycle analysis of R1-ESCs overexpressing CA-Akt3 (CA-Akt3/R1) or a vector control (Ctl/R1). The percentages of cells in G1, S, and G2 phases are shown (data shown are mean±s.d., *P<0.05, n=2).

