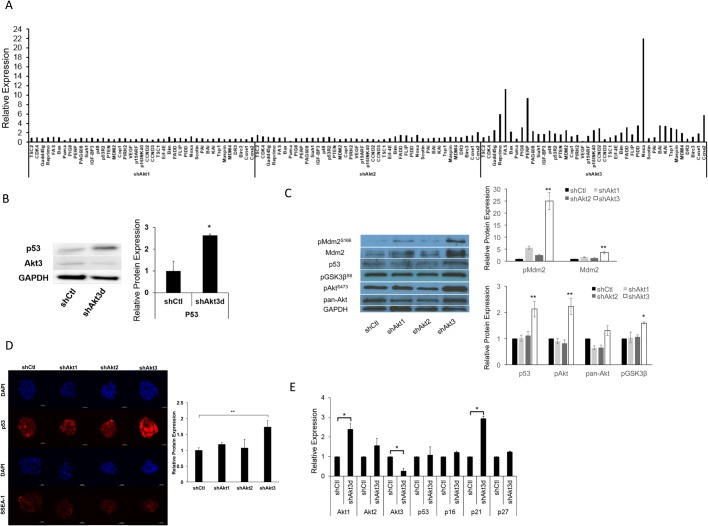
Fig. 5.
Akt3 knockdown results in increased p53 activity post-transcriptionally. (A) qRT-PCR analysis of RNAs from R1-ESCs treated with lentiviral shCtl, shAkt1, shAkt2, or shAkt3 for 3 days and cultured in 2i/LIF medium. All values were normalized to GAPDH and relative to the expression of shCtl ESCs. (B) Western blot of whole protein extracts from ESCs treated with lentiviral shCtl or shAkt3d and grown for 3 days. The specific proteins probed were p53 and Akt3. Protein levels of p53 were quantified using the BioRad Gel Doc Densitometry software. All values were normalized to GAPDH and relative to the expression of shCtl ESCs (data shown are mean±s.d., *P<0.05, n=2). (C) Western blot of whole protein extracts from ESCs treated with lentiviral shCtl, shAkt1, shAkt2, or shAkt3 for 3 days and cultured in 2i/LIF medium. The specific proteins probed were phospho (P) Mdm2, Mdm2, p53, pGSK3β, pAkt, and pan-Akt. Protein levels of pMdm2, Mdm2, p53, pAkt, pan-Akt, and pGSK3β were quantified using the ImageJ software. All values were normalized to GAPDH and relative to the expression of shCtl ESCs (data shown are mean±s.d., *P<0.05, **P<0.01, n=2). (D) Immunostaining of ESCs treated as described in (C). Cells were stained with antibodies for p53 and the stem cell surface marker SSEA-1. Cell nuclei were counterstained with DAPI. Scale bar: 10 µm. Fluorescence signals under each condition were quantified using the ImageJ software, the mean ratios of p53 and DAPI relative to the control ESCs were shown (data shown are mean±s.d., **P<0.01, n=5). (E) qRT-PCR analysis on RNAs from R1-ESCs treated with either shCtl, shAkt1, shAkt2, or shAkt3d lentiviruses for 3 days and cultured in 2i/LIF medium. All values were normalized to GAPDH and relative to ESCs treated with shCtl (data shown are mean±s.d., *P<0.05, n=3).

