Fig. 3.
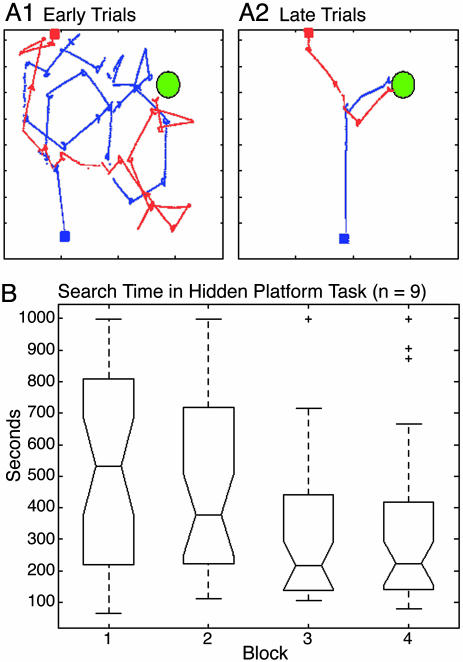
Behavioral performance in the hidden platform task. (A) Trajectories of a subject during the training paradigm. The green circle denotes the location of the platform during training trials. Red and blue squares denote starting locations. Red and blue lines indicate trajectories during individual trials. (A1) Early trials. (A2) Late trials. (B) Box plot of the search times over the course of the experiment for the nine subjects. Each subject ran 16 trials in which a block consisted of four trials, each with a different starting location. The middle line of each box is the median search time, the lower line is the 25th percentile, and the upper line is the 75th percentile. The lines extending from the box show the extent of the sample except for outliers. Outliers, which are data points >1.5 times the upper quartile, are denoted by a “+”. Search times were significantly shorter for blocks 3 and 4 than block 1 (P < 0.01; Wilcoxon signed-rank test).

