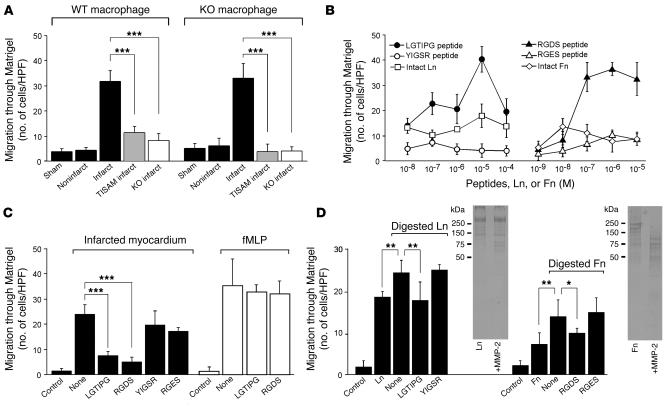
Figure 10.
Macrophage migration in response to infarcted myocardium (A), laminin and fibronectin peptides (B), inhibition of migration activity to infarcted myocardium by laminin and fibronectin peptides (C), and digestion products of laminin and fibronectin by MMP-2 (D). (A) Migration activity of macrophages derived from WT and MMP-2–KO mice in response to infarcted myocardium from vehicle-treated WT (Infarct), TISAM-treated (TISAM infarct), and MMP-2–KO mice (KO infarct). As for controls, myocardium from sham-operated WT mice (Sham) and from noninfarct areas of infarcted vehicle-treated WT mice (Noninfarct) was used. HPF, high-power field. ***P < 0.001. (B) Migration activity of macrophages from WT mice in response to laminin peptides (LGTIPG and YIGSR) and intact laminin (Ln) and fibronectin peptides (RGDS and RGES) and intact fibronectin (Fn). (C) Inhibition of WT macrophage migration activity to infarcted myocardium or fMLP by laminin and fibronectin peptides. Macrophages were incubated with buffer alone (None), laminin peptides, or fibronectin peptides and then subjected to a migration assay by the addition of infarcted myocardium from WT mice or fMLP to lower chambers. Control, GBSS-BSA alone in lower chambers. ***P < 0.001. (D) Macrophage migration in response to MMP-2 digestion products of laminin and fibronectin. Macrophages were incubated with buffer alone, laminin, or fibronectin peptides and then subjected to a migration assay by the addition of the digestion products to lower chambers. Control, Ln, and Fn represent GBSS-BSA alone, laminin alone, and fibronectin alone in lower chambers, respectively. Digestion patterns of laminin and fibronectin on SDS-PAGE are shown. *P < 0.05; **P < 0.01.

