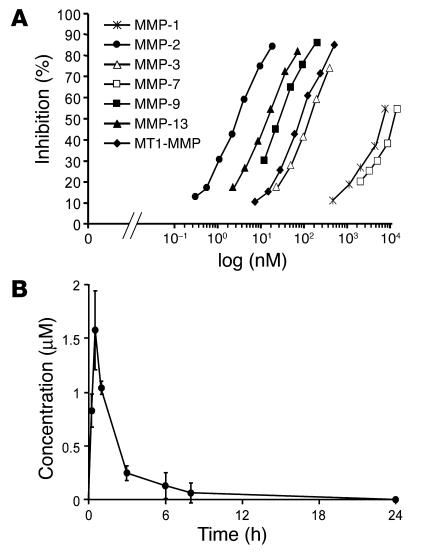
Figure 3.
Concentration-dependent inhibition of TISAM by 7 different MMPs and plasma concentration–time profile in mice. (A) The IC50 values log (nM) for MMP-1, -2, -3, -7, -9, and -13 and MT1-MMP were determined based on a nonlinear regression fit of the concentration-dependent reaction rates using quenched fluorescent peptide substrates. (B) The mean plasma concentrations of TISAM at 0, 0.25, 0.5, 1, 3, 6, 8, and 12 hours after an oral administration were measured.

