Figure 2.
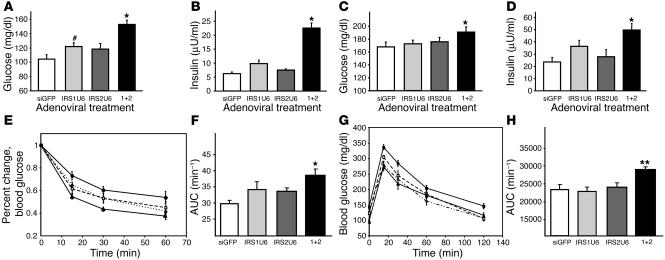
Dual knockdown of IRS-1 and IRS-2 results in defects in glucose homeostasis. Fasting blood glucose (A) and insulin levels (B) as well as random-fed blood glucose (C) and insulin levels (D) of mice treated with RNAi adenovirus. Glucose and insulin levels are plotted as the mean ± SEM (n = 10–20 mice per treatment group in both fasted and fed state). (E) Insulin tolerance tests (1 U/kg, i.p.) were performed 5 days after adenovirus injection. Results represent blood glucose concentration as a percentage of starting value at time point 0 and are expressed as mean ± SEM (n = 8). (F) Results from E expressed as area under ITT curves. AUC, area under the curve. (G) Glucose tolerance tests (2 g/kg, i.p.) were performed on mice following a 16-hour fast 5 days after adenovirus injection. Blood samples were collected and glucose measured at the times indicated. (H) Results shown in G expressed as area under GTT curves. Open circles, siGFP; closed squares, IRS1U6; open diamonds, IRS2U6; closed circles, both IRS1U6 and IRS2U6. *P < 0.05 vs. siGFP; **P < 0.01 vs. siGFP; #P = 0.06 vs. siGFP.

