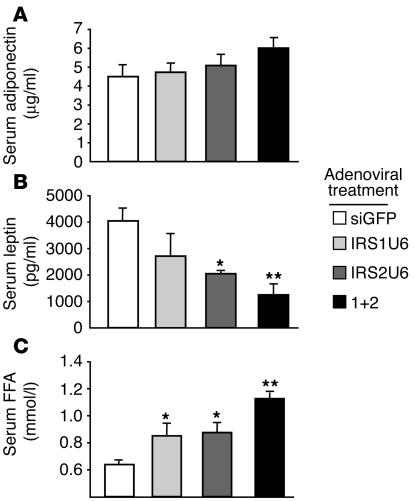
Figure 5.
Decreased leptin and increased FFA levels in IRS-knockdown mice. (A) Serum adiponectin levels of random-fed mice treated with RNAi adenovirus. (B) Serum leptin levels of random-fed mice treated with RNAi adenovirus. (C) Serum free fatty acid levels in random-fed knockdown mice. Bars represent mean ± SEM (n = 5). *P < 0.05 vs. single treatment vs. siGFP treatment; **P < 0.01 vs. siGFP treatment.

