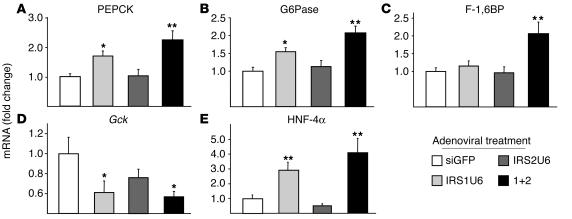
Figure 6.
Downregulated IRS protein expression in liver results in changes in expression of gluconeogenic genes and Gck. The relative mRNA levels of indicated genes in the livers of fasting mice treated with RNAi adenovirus, as measured by quantitative RT-PCR: (A) PEPCK, (B) G6Pase, (C) F-1,6BP, (D) Gck, and (E) HNF-4α. Vertical axes represent the fold change in mRNA levels compared with siGFP treatment. The bars represent the fold change in expression of each gene relative to the mean expression in siGFP-treated controls ± SEM (n = 8). *P < 0.05 vs. siGFP treatment; **P < 0.01 vs. siGFP.

