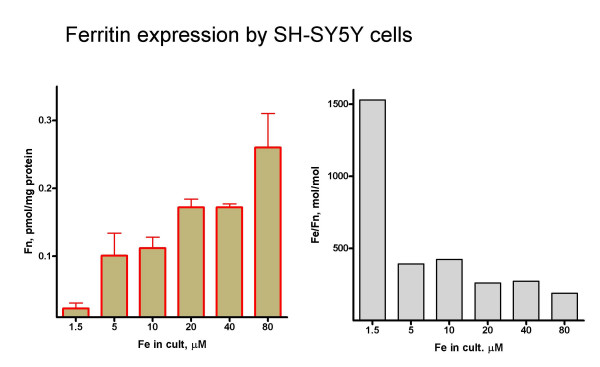
Figure 3.

Ferritin content A: ferritin was determined in extracts from cells cultured for 2 days with different iron concentrations as described in Figure 1A. Data is mean ± SD from 4 independent determinations. B: iron : ferritin molar ratio. Total iron and ferritin total data were from Figure 1B and 3A, respectively. Ferritin synthesis response was larger that iron accumulation, an indication of a very active IRE/IRP system.
