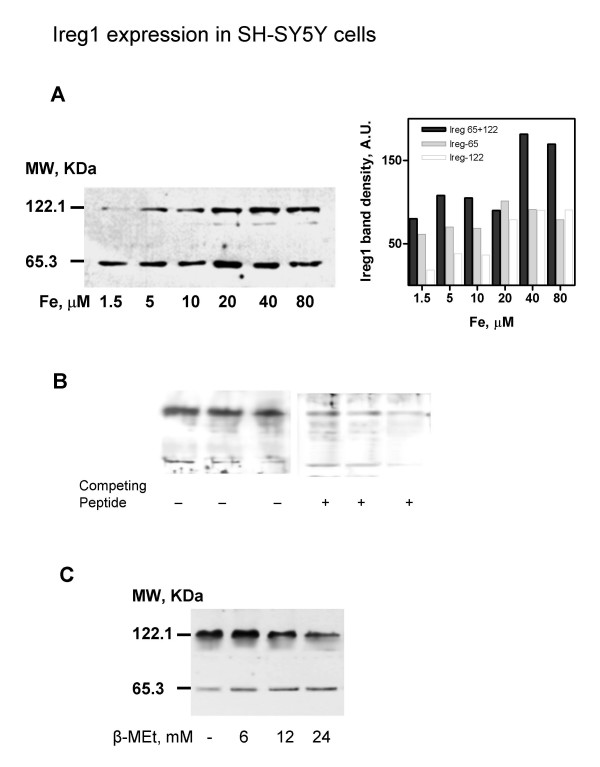
Figure 5.

IREG1 expression increases upon increasing iron exposure. IREG1 from cells cultured for 2 days with different iron concentrations was determined by Western blot. A shows results of one of two similar experiments. Bands of 65.3 and 122.1 KDa were evident. The side panel shows the densitometric analysis of the bands. The 122.1 KDa band increased in the 1.5 to 40 mM Fe range. B: Both the upper, 122.1 KDa, band and the lower, 65.3 KDa, band diminished when the antibody was pre-incubated with peptide CGPDEKEVTKENQPNTSVV, prior to Western blot of 30, 20 and 10 mg of cell extract. C: treatment of 80 mM Fe extracts with increasing b-mercaptoethanol. A decrease in the 122.1 KDa band with increased b-mercaptoethanol was apparent.
