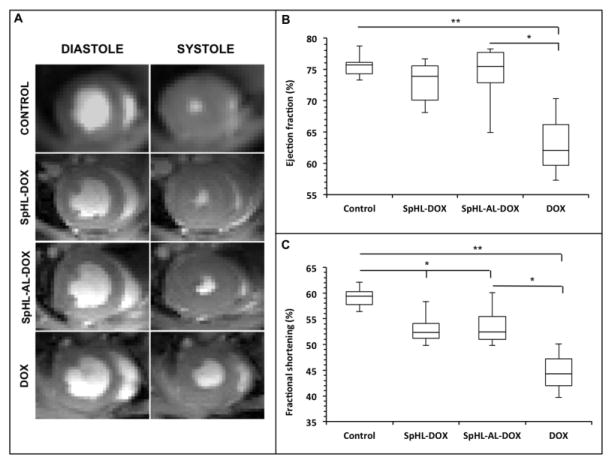
Figure 3.
Representative in vivo MR images of treated animal hearts at the end of diastole (left images) and systole (right images) showing the shortening of left ventricle volume (A). Quantification of ejection fraction (B) and fractional shortening (C) for the animals treated with free or liposomal DOX. Results are expressed as median and inter-quartile range for control (n = 5), SpHL-DOX (n = 5), SpHL-AL-DOX (n = 8), and DOX (n = 3) groups. Comparisons for significant differences between the groups (* = p < 0.05, ** = p < 0.01) used Kruskall-Wallis’ test followed by Dunns’ test).

