
Figure 4.
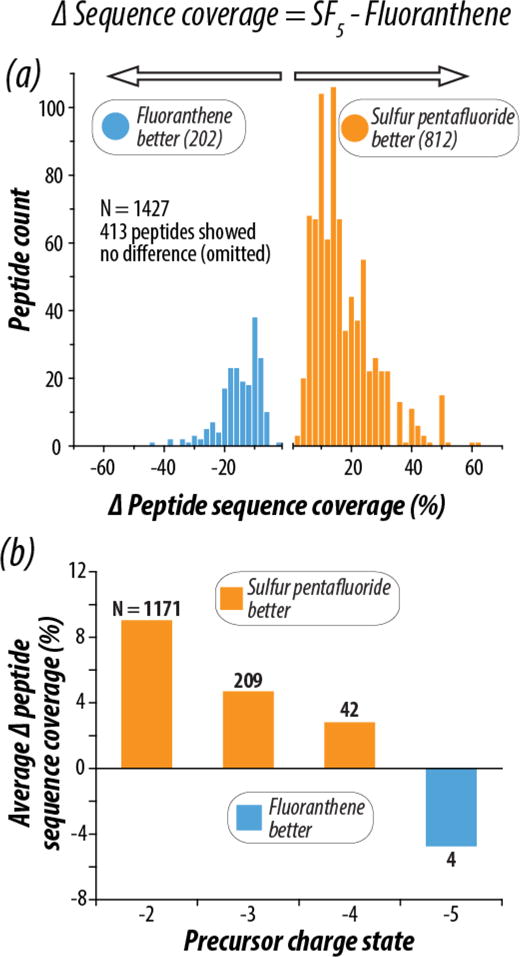
(a) Percent peptide sequence coverage was calculated for each of the 1427 peptides in common between the SF5•+ and C16H10•+ analyses. The difference between peptide sequence coverage with SF5•+ and C16H10•+ (Δ Peptide Sequence Coverage) was calculated for each peptide, and the distribution of the Δ Peptide Sequence Coverage values are shown. The orange distribution shows peptides with greater sequence coverage with SF5•+ (n = 812), and the blue shows peptides with better sequence coverage with C16H10•+ (n = 202). Panel (b) shows the average Δ Peptide Sequence Coverage for all peptides in common between the two analyses as a function of peptide precursor charge state. The number of precursors averaged is shown in black text above the bar for each charge state. Concordant with previously shown data, lower charged precursors benefit most from the use of SF5•+.