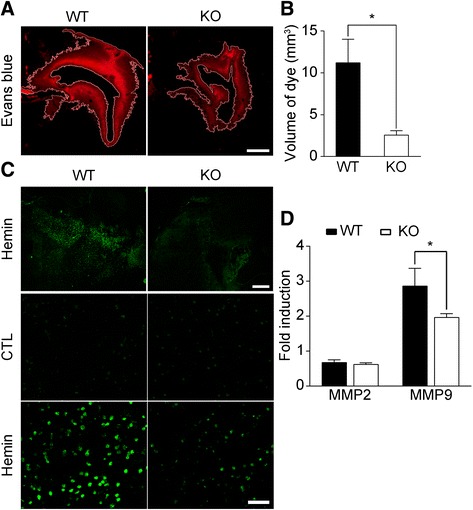
Fig. 4.

Hemin injection activates MMP9 and induces BBB damage via TLR2. a-b WT and TLR2 KO mice were administered 250 nmol of hemin in the striatum followed by intravenous Evans blue dye injection. After 24 h, brain sections were prepared and Evans blue staining was visualized to measure BBB damage. Scale bar: 1 mm. The injury volume (mm3) was calculated by multiplying the section thickness by the Evans blue-stained area. The data are expressed as mean ± SEM (* p < 0.05 vs. hemin-injected WT mice, n = 4). c The gelatinase activity in the injured brains of WT and TLR2 KO mice was measured using in situ zymography. The fluorescence due to gelatinase activity in the perihematomal region was visualized under a fluorescence microscope (upper four panels, scale bar: 500 μm). Magnified images are shown in the lower two panels (scale bar: 50 μm). d RNA was isolated from the injured tissue of WT and TLR2 KO mice 6 h after either saline- or hemin-injection (n = 4), and used for real-time RT-PCR to measure MMP2 and MMP9 mRNA levels. The mRNA levels of the hemin-injected mice were normalized to the levels of the saline-injected mice, and presented as fold induction. The data are presented as mean ± SEM (* p < 0.05 vs. WT mice)
