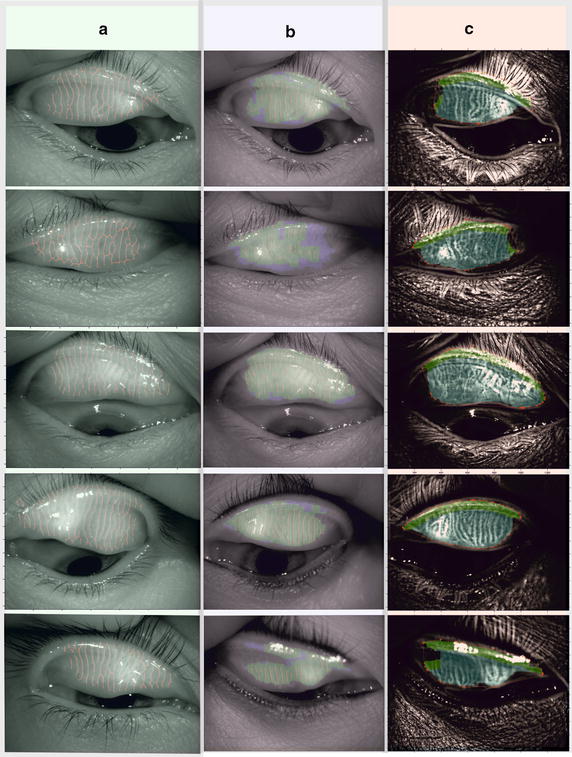
Fig. 6.

Exemplary results allowing the qualitative comparison of two methods: a image with automatically marked location of Meibomian glands according to the method described in [41]; b area covering Meibomian glands according to the method described in [41] and c results of analysis described in this article (indications complying with indications in b)
