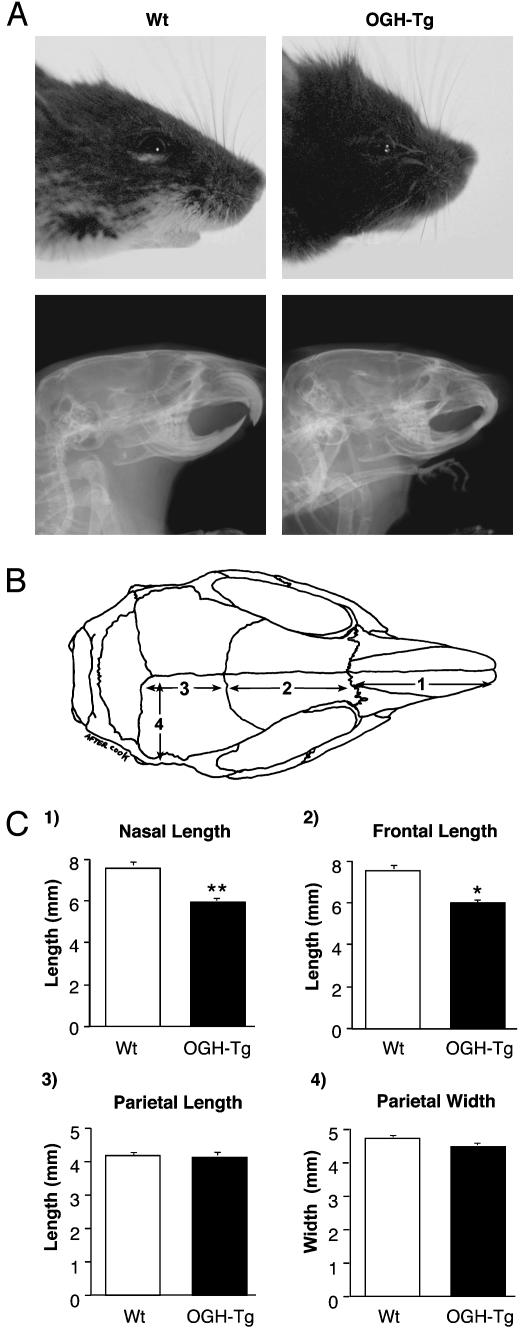
Fig. 2.
Histomorphometric analysis of skull bones. (A) Bright field (Upper) and x-ray (Lower) photographs of WT and transgenic (OGH-Tg) male animals. (B) Schematic representation of the skull bones. (C) Average lengths and widths of the skull bones from adult WT (four male and four female) and transgenic (OGH-Tg; three male and four female) animals. *, P < 0.05, compared with WT littermate controls.

