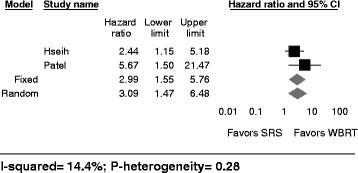
Fig. 4.

Leptomeningeal Disease after SRS versus WBRT following neurosurgical resection. Forest plot represents the risk ratio for overall survival of intracranial metastasis following resection and SRS versus resection and WBRT (95% confidence interval [CI]) with 2 cohort studies in adults (n = 152 patients (SRS) and 192 patients (WBRT)). Solid squares represent the point estimate of each study and the diamond represents the pooled estimate of the risk ratio. The I 2 and P values for heterogeneity are shown
