
Figure 5. Simulated SCN networks that capture resynchronization dynamics also entrain with realistic photoperiodic properties.
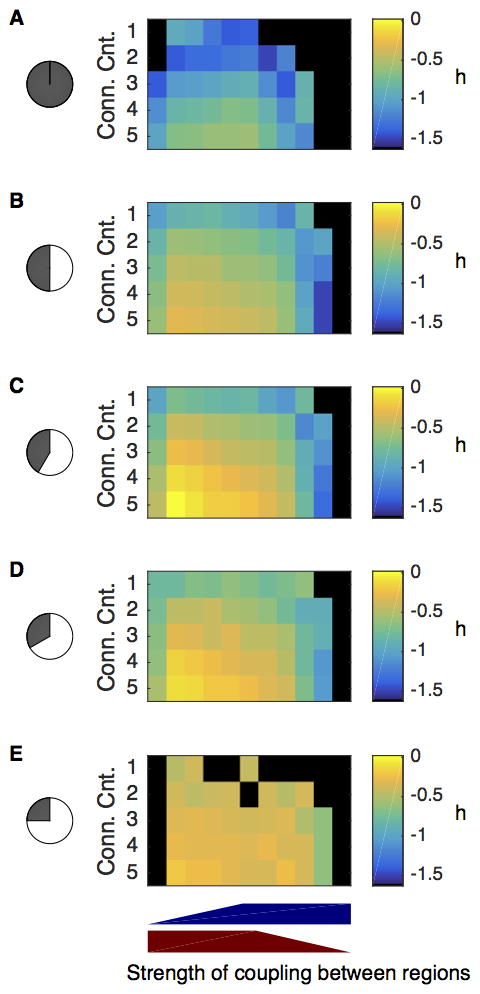
Shown are heat maps of spread in timing of core-shell peak PER expression from simulated SCN networks under 5 light:dark conditions (A) constant darkness, B) LD12:12, C) LD14:10, D) LD16:8, and E) LD18:6). Note that the peak time difference between the core and shell depended on the light:dark cycle (where negative values indicate the shell peaks earlier). For all simulations, the regional core network was dense, the shell was sparse, and shell oscillators were intrinsically faster than core oscillators. Each cell in the heat map represents a given number (Conn. Cnt.) and strength of connections between the regions (strength from core to shell indicated by red wedge, strength from shell to core indicated by blue wedge) and averages the results across simulations using all 83 VRC’s.