
FIGURE 1. Flowchart of the study population.
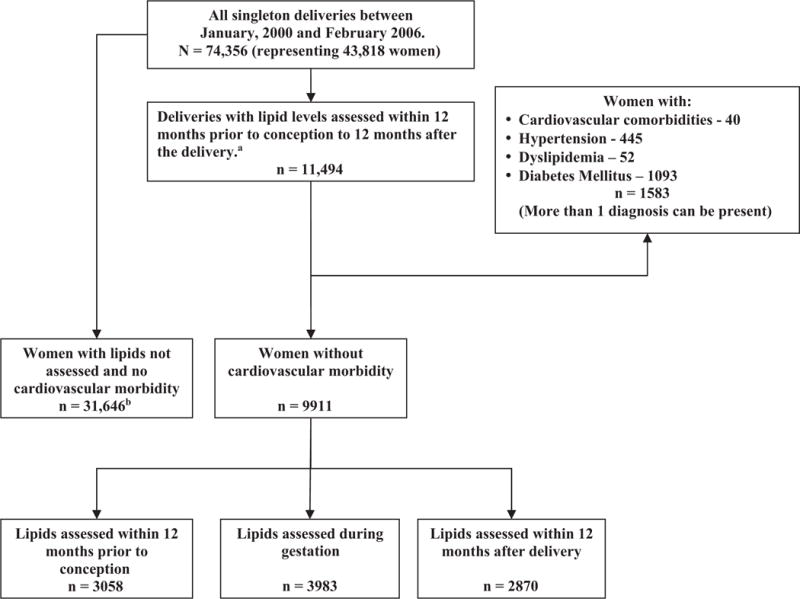
aIn case a woman had >1 pregnancy during the defined period, and ≥1 lipidograms, a gestation with the conception closest to the lipidogram date was chosen; bChosen at random from 52,815 deliveries during study period with no lipids analysis between 12 months prior to conception and 12 months following the delivery.