
FIGURE 2. Levels of TC, TGs, HDL, and LDL 1 year before, during, and 1 year after gestation.
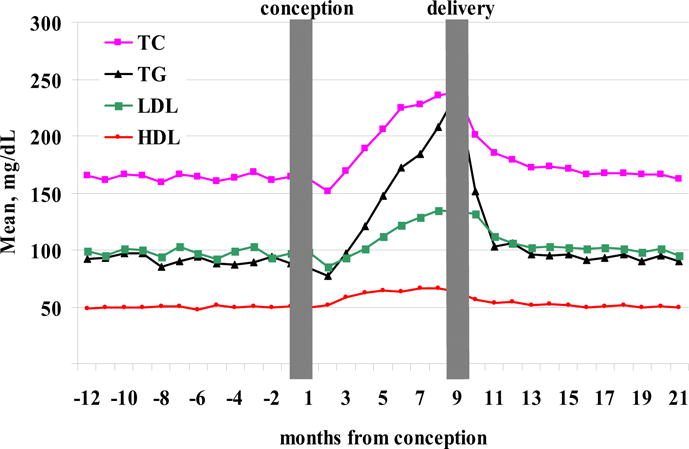
Time 0 represents calculated conception date. Women with preeclampsia or gestational diabetes mellitus are excluded.
Official websites use .gov
A
.gov website belongs to an official
government organization in the United States.
Secure .gov websites use HTTPS
A lock (
) or https:// means you've safely
connected to the .gov website. Share sensitive
information only on official, secure websites.
Time 0 represents calculated conception date. Women with preeclampsia or gestational diabetes mellitus are excluded.