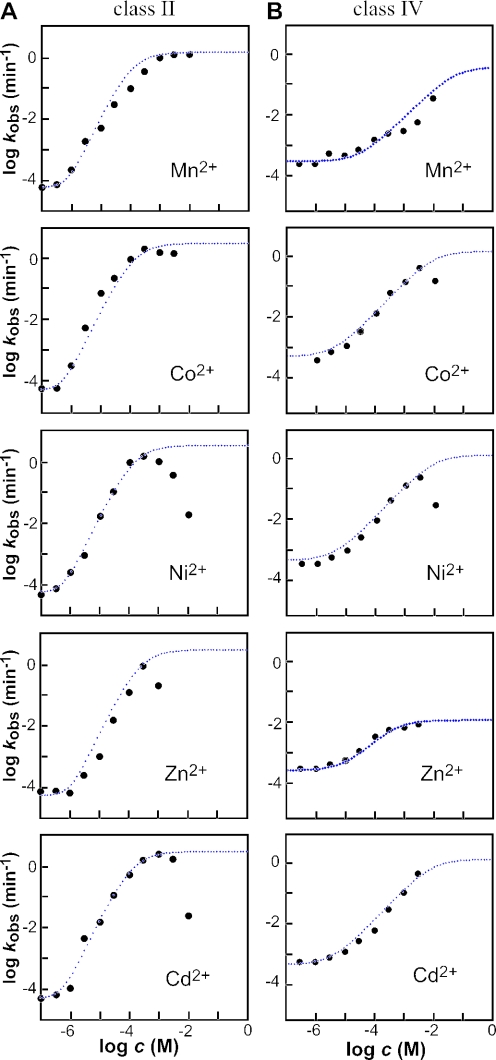
Figure 3.
The dependence of ribozyme activity on the concentration of divalent metal ion effector. Plots of the logarithm of the rate constant for ribozyme cleavage versus the logarithm of the concentration of divalent metal effector for the class II (A) and class IV (B) allosteric ribozymes. Each point represents a kobs value calculated by conducting a time course for ribozyme activity and determining the negative slope of the line from a plot of the natural logarithm of the fraction of RNA remaining uncleaved versus time (min−1). For the class II ribozyme, the dotted lines in the case of Cd2+, Co2+ and Ni2+ represent the expected plot for an ideal ribozyme with a kmax of 3 min−1, a kmin of 4.8 × 10⁻⁵ min−1 and two critical metal-binding sites each with an apparent KD of 130 μM, as determined by a variation of the Henderson–Hasselbach equation. The apparent KD, kmax and kmin parameters plotted for Mn2+ are 100 μM, 1.5 min−1 and 6.7 × 10⁻⁵ min−1 and for Zn2+ are 220 μM, 3 min−1and 4.8 × 10⁻⁵ min−1, respectively. For the class IV ribozyme, dotted lines in the case of Cd2+, Co2+ and Ni2+ represent the expected plots for and ideal ribozyme with an apparent KD of 1 mM, a kmax of 1 min−1 and one critical metal-binding site. The apparent KD, kmax and kmin parameters plotted for Zn2+ are 5 × 10⁻⁴, 0.01 min−1 and 2 × 10⁻⁴ min−1 and for Mn2+ are 0.07, 0.7 min−1 and 3.5 × 10⁻⁴ min−1, respectively.

