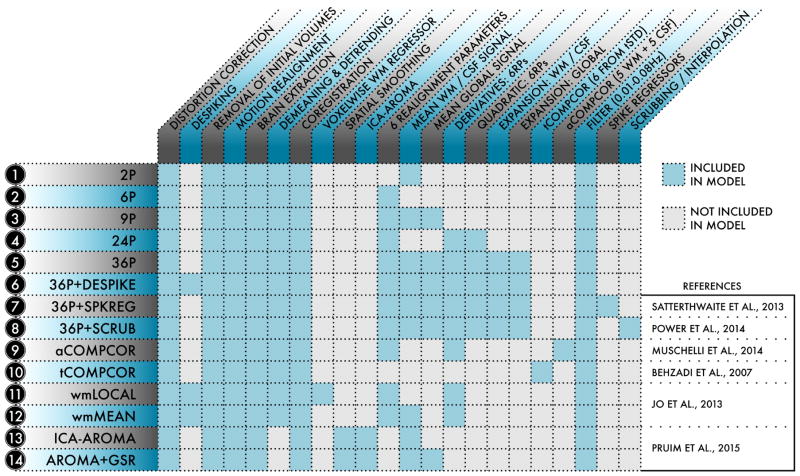
Figure 1. Schematic of the 14 de-noising models evaluated in the present study.
For each of the 14 models indexed at left, the table details what processing procedures and confound regressors were included in the model. De-noising models were selected from the functional connectivity literature and represented a range of strategies.

