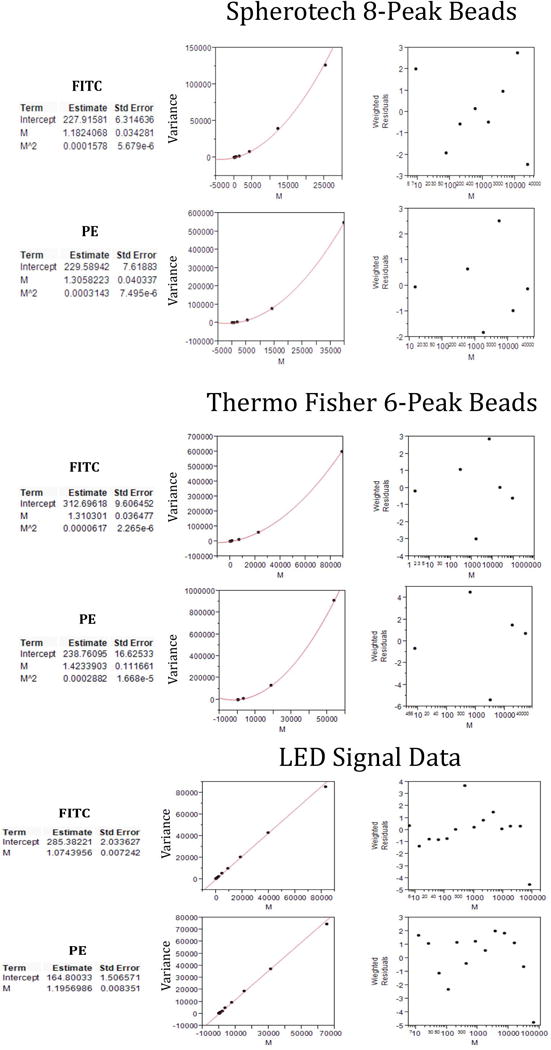
Figure 2.

Examples of fitting procedure outputs for fit parameters, fit curves and weighted residuals on multi-level bead and LED data. The upper, middle and lower sections each show results in FITC and PE measurement channels for Spherotech 8-peak (Sph8), Thermo Fisher 6-peak (TF6) and LED measurements, respectively. These results were produced in JMP, and the fit parameters Intercept, M and M^2 correspond to c0, c1 and c2, respectively, in the R analysis. The population means M are in instrument measurement units. Linear fitting was used for the LED data, so there is no M^2 parameter in the results. The left plots show the fit curve in relation to the fitted data points. The right plots show the weighted residuals for each of the data points.
