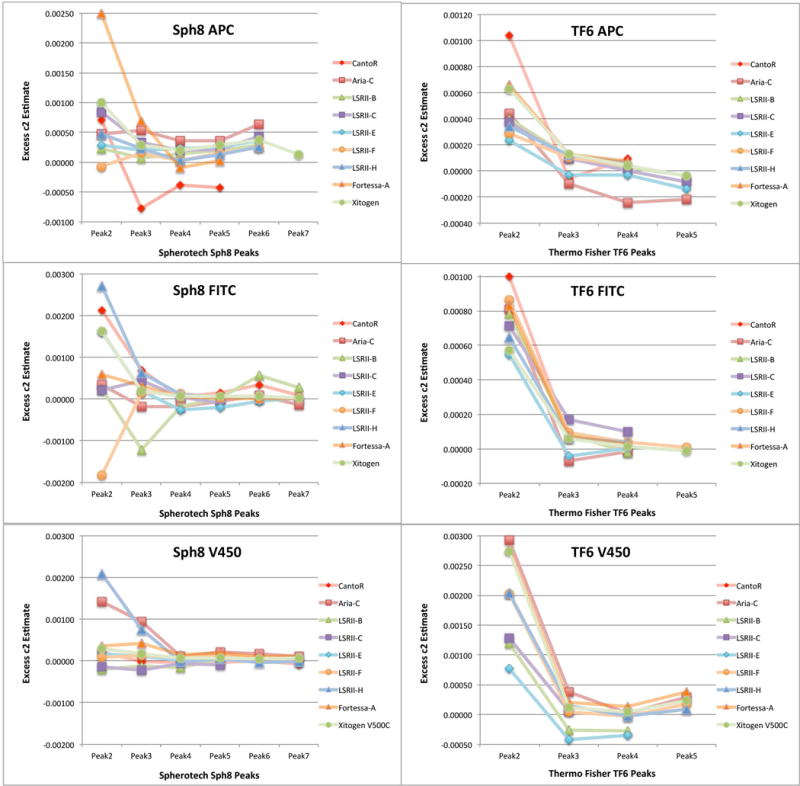
Figure 5.

“Excess c2” among lower signal bead peaks in Sph8 and TF6 is an indicator of differences in intrinsic CV among the bead populations. For each bead peak between the unstained and the brightest used in the fitting procedure, we calculated a residual variance by subtracting the expected background variance (c0) and the expected linear term variance using the c1′ value of the corresponding LED fit from the observed total variance. Dividing this by the square of the peak mean gives an effective c2 residual and subtracting the effective c2 for the highest peak in the fit from the others gives “Excess c2” values for the intermediate peaks that can be compared among different peaks and instruments. The figure illustrates results for three measurements (APC, FITC and V450 dye channels) on nine instruments.
