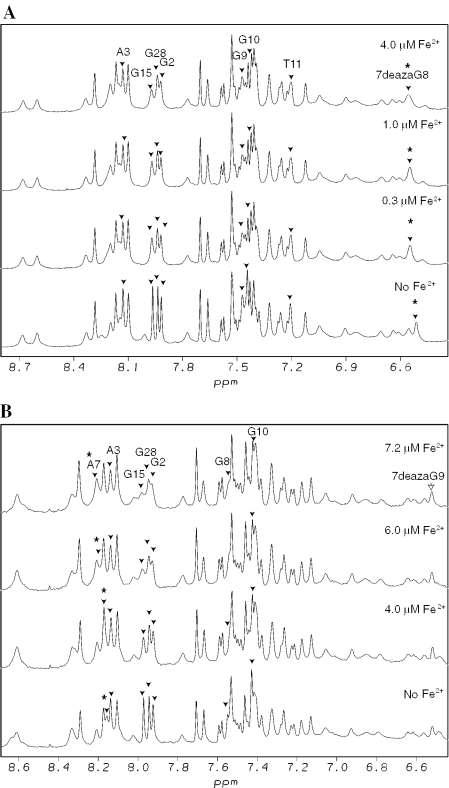
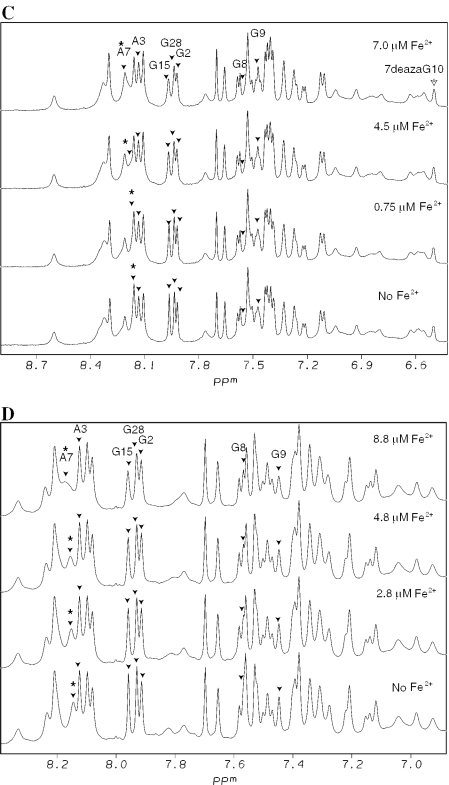
Figure 4.
Aromatic (H6/H8) region from 1H NMR spectra of Fe2+ titrations of modified duplexes. All samples were in 90% H2O/10% D2O and contained 130 mM NaCl. Fe2+ concentrations are indicated at the right of the spectra. Filled arrows indicate preferential broadening, asterisks (*) indicate shifting among aromatic proton resonances, and non-filled arrows indicate the Z H8 proton resonances. (A) 0.68 mM AZGG duplex. (B) 0.3 mM AGZG duplex. (C) 0.5 mM AGGZ duplex. (D) 1.15 mM AGGT duplex.


