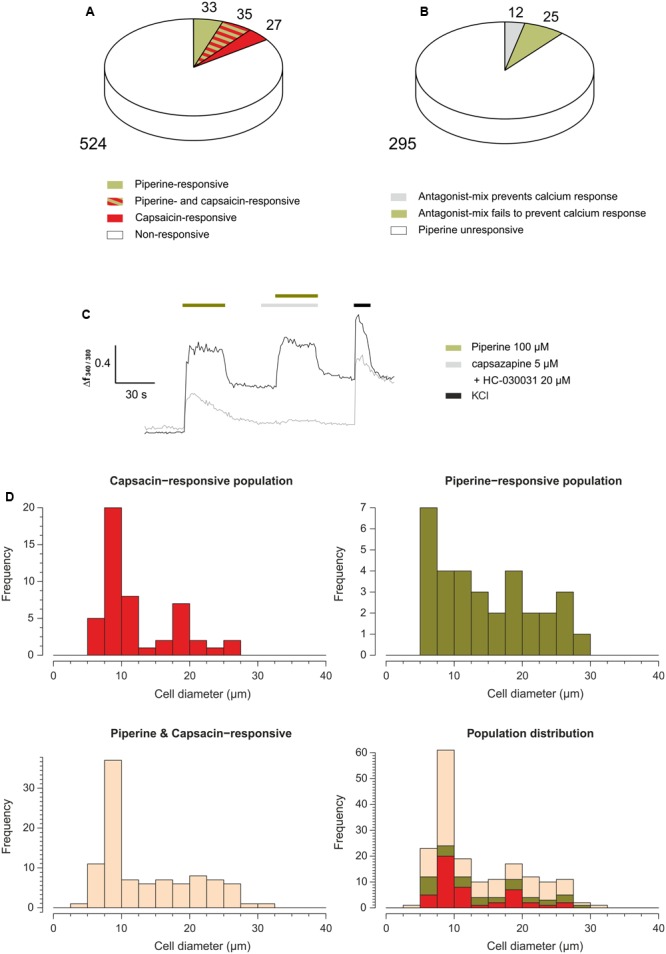
FIGURE 3.

(A) Pie chart indicating the percentage of piperine- (100 μM) and/or capsaicin- (10 μM) responsive trigeminal neurons. N = 619 neurons from 23 separate experiments. (B) Pie chart indicating the percentages of piperine-unresponsive neurons (white slice), and piperine-responsive neurons (gray and green slices). The neurons that responded to a first application of piperine (100 μM) are subdivided into those in which a second response to piperine (100 μM) was prevented by preincubation and simultaneous co-application with an antagonist-mix consisting on 20 μM HC-030031 and 5 μM capsazepine (gray slice) and those in which the antagonist-mix failed to prevent a calcium response (green slice). N = 332 neurons from 13 separate experiments. (C) Representative Ca2+ imaging traces of two mouse trigeminal neurons subjected to the application of piperine 100 μM; capsazepine 5 μM and HC-030031 20 μM; piperine 100 μM, capsazepine 5 μM and HC-030031 20 μM; and KCl 150 mM. (D) Histogram of the distribution of mouse trigeminal neurons in their function to cell diameter and their responsiveness to capsaicin and piperine, N = 179 neurons from nine separate experiments.
