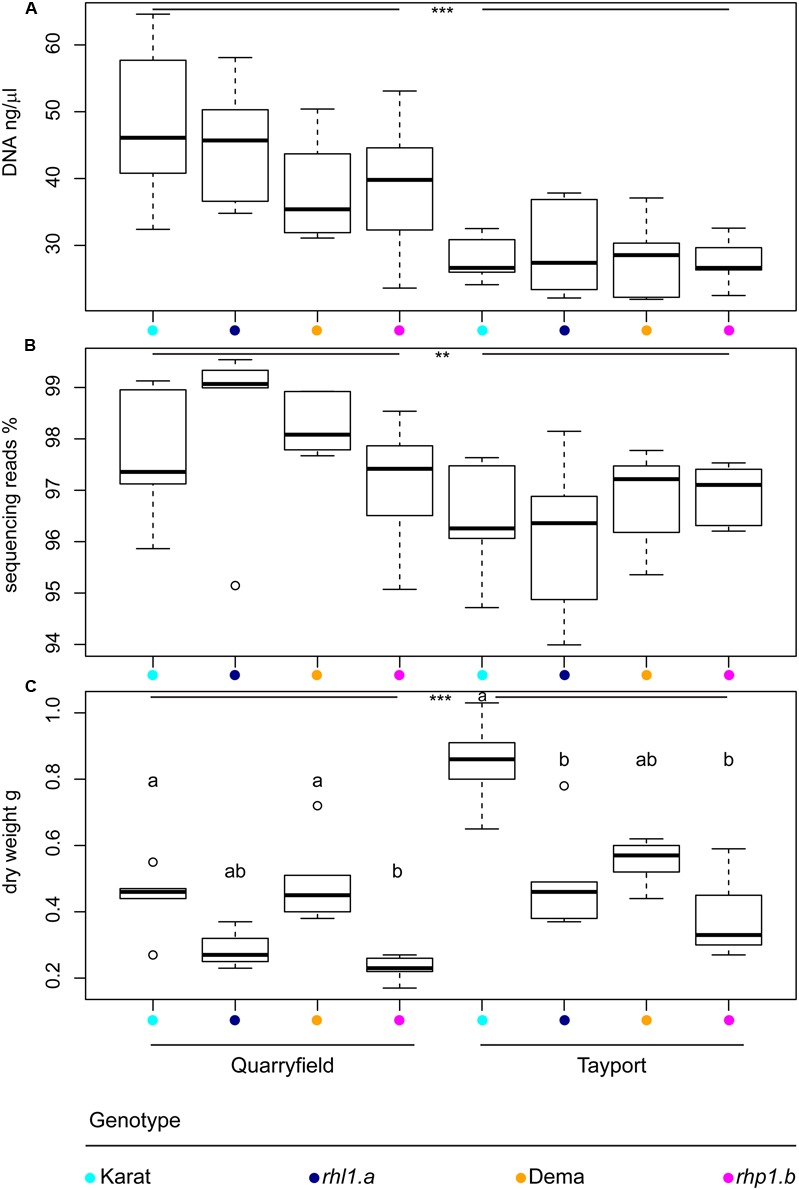
FIGURE 2.

The soil type defines microbiota DNA properties and plant growth. Average (A) DNA concentration of the rhizosphere preparations, (B) proportion of sequencing reads assigned to microbial OTUs, and (C) above ground biomass of the indicated plant genotypes grown in Quarryfield and Tayport soils. Upper and lower edges of the box plots represent the upper and lower quartiles, respectively. The bold line within the box denotes the median. Maximum and minimum observed values are represented by the whiskers. Dots denote outlier observations whose value are 3/2 times greater or smaller than the upper or lower quartiles, respectively. Asterisks denote statistically significant differences between soil types (∗∗∗P < 0.001, ∗∗P < 0.01). In (C) different letters denote statistically significant differences between genotypes by Kruskal–Wallis non-parametric analysis of variance followed by Dunn’s post hoc test (P < 0.05, BH corrected).
