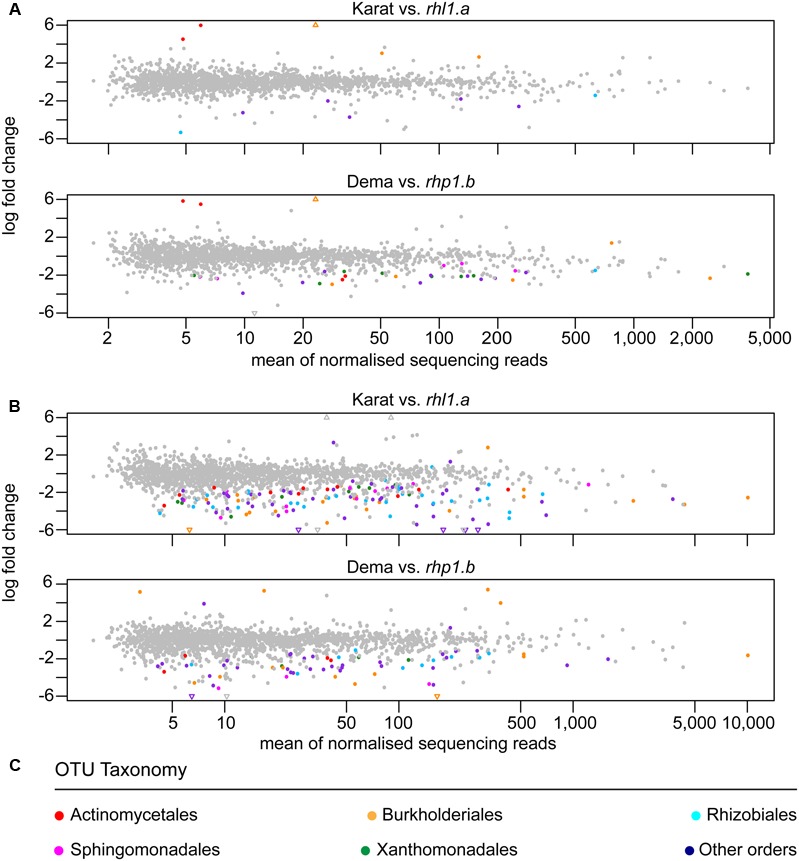
FIGURE 6.

Individual bacteria discriminate between the microbiotas of wild-type and root hair mutants. OTUs differentially enriched in the indicated pair-wise comparisons between genotypes grown in (A) Quarryfield soil or (B) Tayport soil. Individual OTUs are depicted by circles whose x–y coordinates are defined by the mean abundance and the logarithmic fold change between wild-type and mutant genotypes, respectively. Triangles represent OTUs whose fold change exceeds the scale on the y-axis. In all the comparisons the positive fold change is associated with the enrichment of an OTU in wild-type specimens. OTUs significantly enriched (Wald test, P < 0.01, FDR corrected) are denoted by colors recapitulating (C) their taxonomic classification at the order level. The gray color indicates OTUs not significantly enriched.
