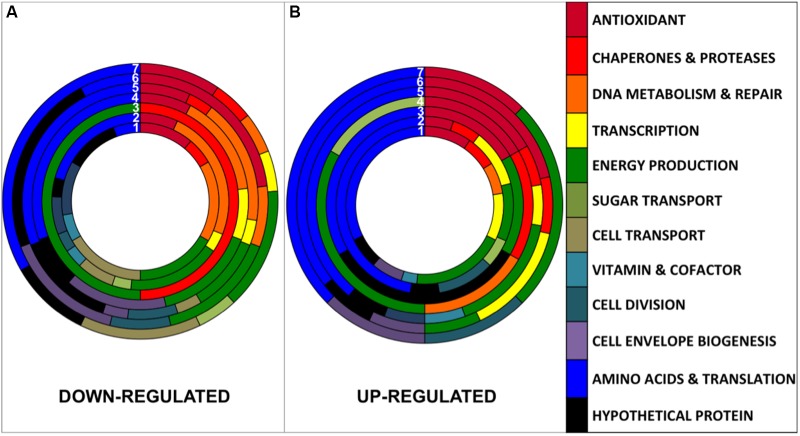
FIGURE 3.
Comparison of the distribution of down-regulated (A) and up-regulated (B) proteins between the different conditions numbered from 1 to 7. (1) Artificial UVB (49 proteins), (2) Natural Full Sun (48 proteins), (3) Natural PAR (8 proteins), (4) Natural PAR+UVA (19 proteins), (5) Natural UVA+UVB (47 proteins), (6) Natural UVB (27 proteins), and (7) Natural UVA (29 proteins).

