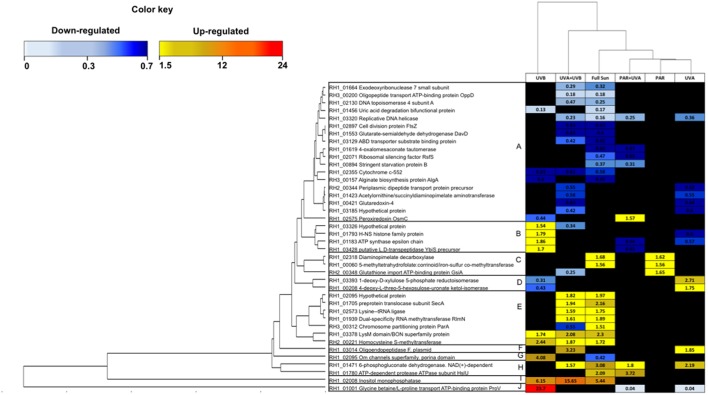
FIGURE 5.
Heat-map showing 40 differentially regulated proteins shared between at least two treatments among the 6 Natural light conditions (Full Sun, PAR, PAR+UVA, UVA+UVB, UVA, UVB). Each cell of the grid was colored based on increased and decreased abundance above 1.5 or below 0.66, respectively.

