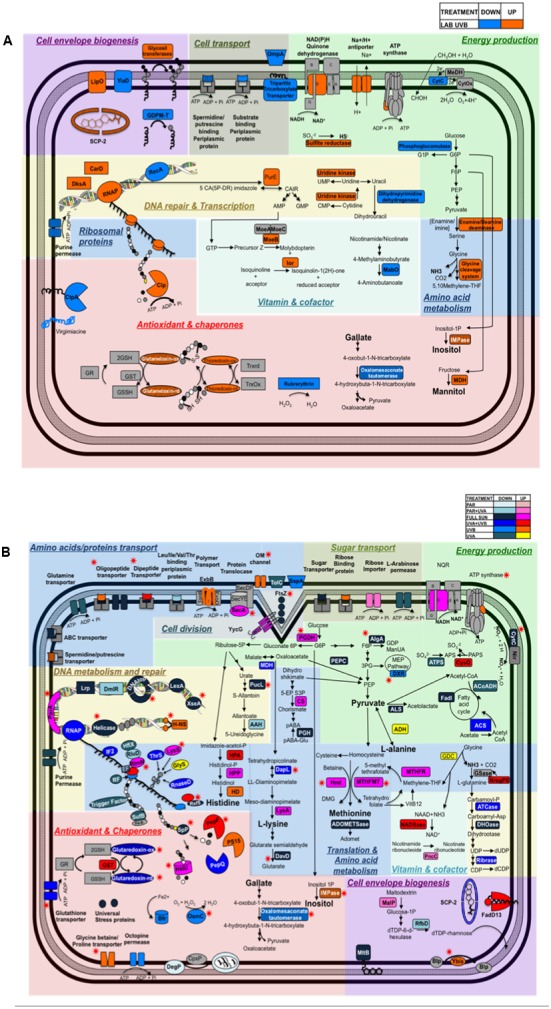
FIGURE 6.

Diagram depicting the cellular pathways impacted by (A) Artificial UVB treatment and (B) Natural light conditions (Full Sun, PAR, PAR+UVA, UVA+UVB, UVB, UVA) in Rhodobacter sp. The up and down-regulated proteins are represented according to the color code provided at the top right corner of the diagram. Striped boxes represent proteins shared by Artificial UVB treatment and Natural light treatments. Red stars indicate proteins shared by more than one condition within among all natural light treatments.
