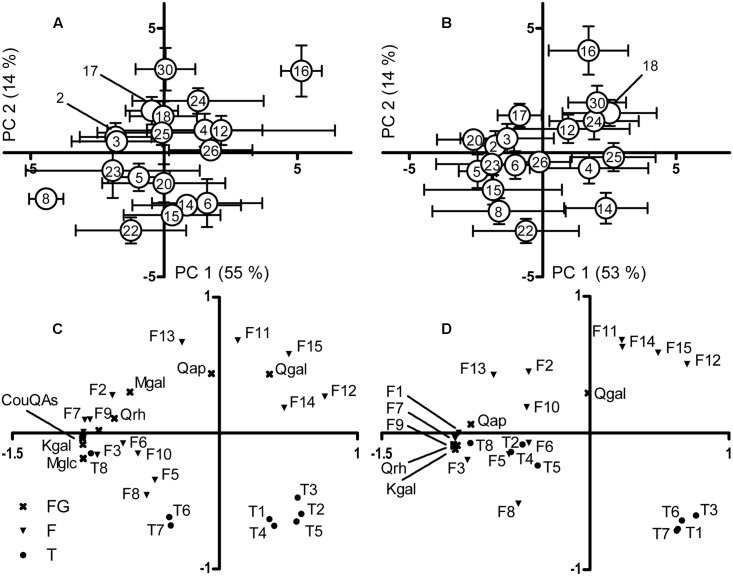
FIGURE 3.
Principal component analysis (PCA) graphs of the secondary metabolite data in (A) senescent leaves and (B) decomposed litter and the loadings of the compounds responsible for the variation on the PC axes as p(corr) values in (C) senescent leaves and (D) decomposed litter. In (A,B), the 19 genotypes are shown as mean axes scores with the vertical and horizontal error bars depicting ±1 SE (n = 4–6). CouQAs, Coumaroylquinic acids; F, Flavonoid aglycone; FG, Flavonol glycosides; Kgal, Kaempferol 3-galactoside; Krh, Kaempferol 3-rhamnoside; Mgal, Myricetin 3-galactoside; Mglc, Myricetin 3-glucoside; Qap, Quercetin 3-arabinopyranoside; Qgal, Quercetin 3-galactoside; Qrh, Quercetin 3-rhamnoside; T, Triterpenoid.

