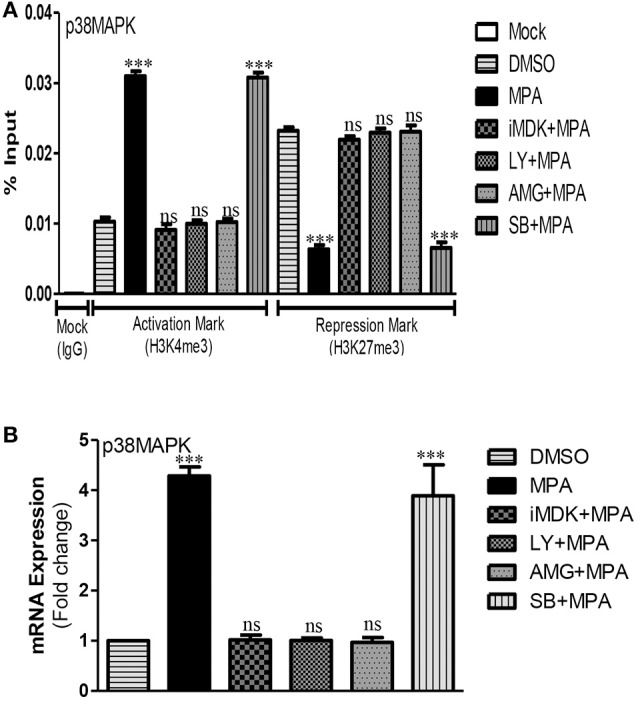
Figure 4.

Midkine/PI3K dependent activation of p38MAPK pathway after MPA treatment. (A) The ChIP-qPCR data of activation mark (H3K4me3) and repression mark (H3K27me3) at the promoter region of p38MAPK in Caco-2 cell monolayers treated with DMSO (Control), MPA alone or in combination with Midkine, and PI3K inhibitors. (B) The mRNA expression levels of p38MAPK either in presence or absence of PI3K inhibitors in MPA treated Caco-2 cell monolayers as compared to control cells. Differences between groups were analyzed by ANOVA with Bonferroni post-test. The values were expressed as mean ± SEM (n = 3), whereas ***P < 0.001, ns, non-significant.
